A Business Intelligence project analysing marketing performance, funnel efficiency, advertising ROI and budget allocation using Power BI, Excel and scenario analysis.
Marketing teams need to understand whether increasing advertising investment is translating into sustainable revenue growth, stronger conversions and improved return on investment.
The objective of this project was to analyse historical marketing performance, identify trends and seasonality, evaluate funnel efficiency and test whether increasing advertising spend would improve marketing returns.
Analyse revenue, leads, conversions and ROI over time to identify trends and seasonal patterns.
Examine website sessions, leads, conversions and lead-to-conversion performance.
Compare advertising spend with revenue and evaluate indicators such as CPL and revenue per lead.
Simulate increased advertising spend and compare the resulting ROI with actual performance.
The dashboard provides an executive-level view of the key marketing performance indicators.
The interactive dashboard was structured around executive performance, funnel performance and marketing spend efficiency.
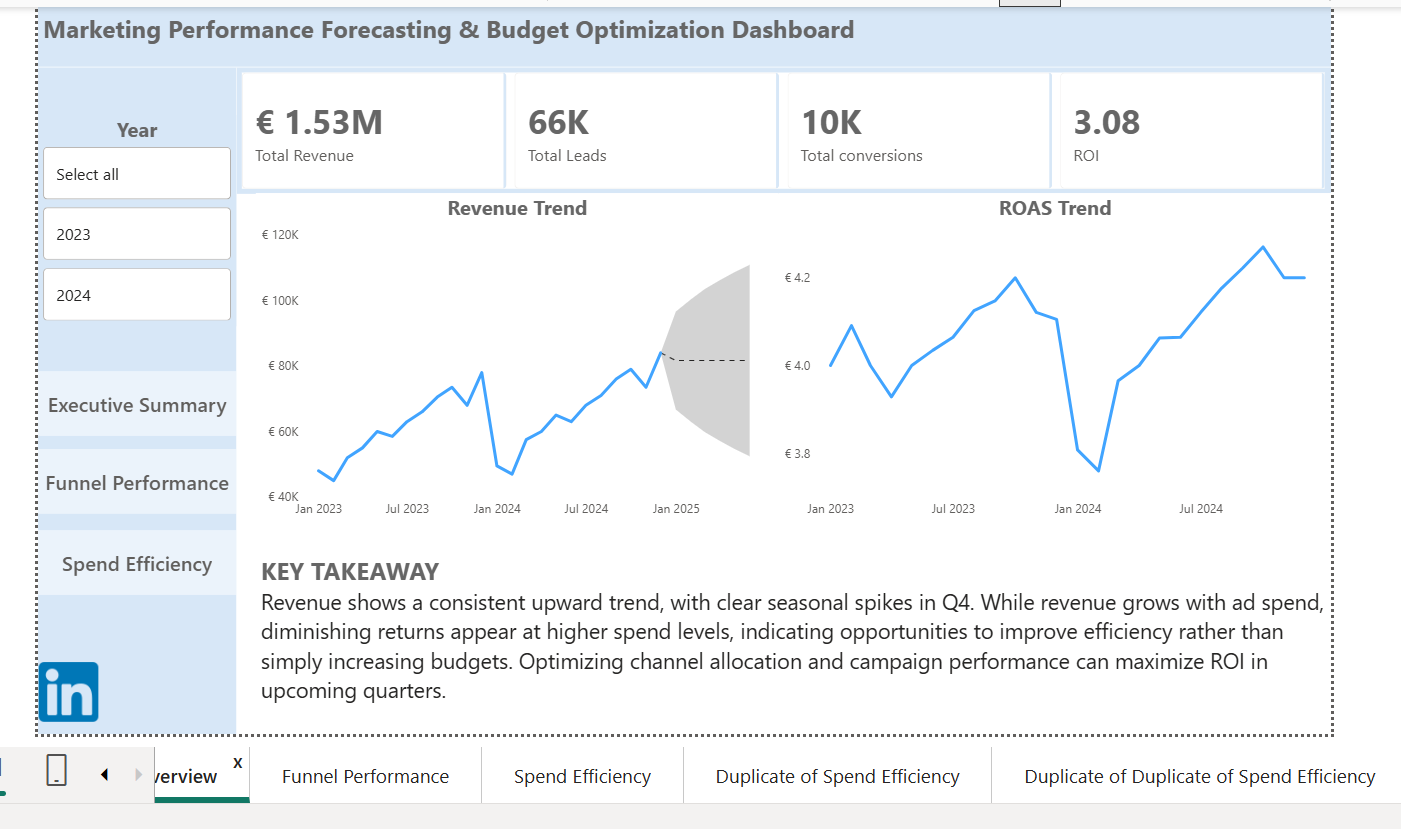
Executive Summary — revenue, ROI and marketing performance trends.
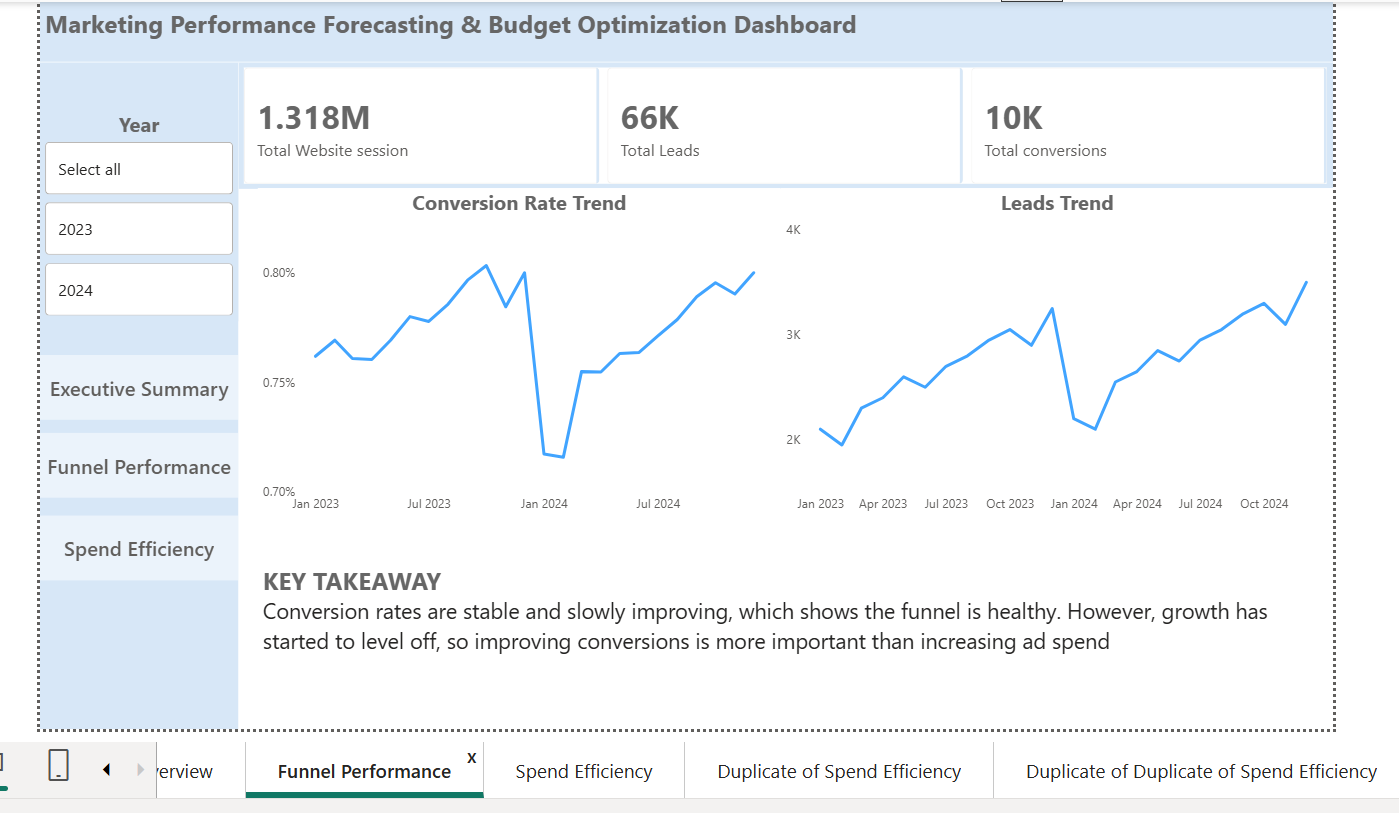
Funnel Performance — website sessions, leads and conversions.
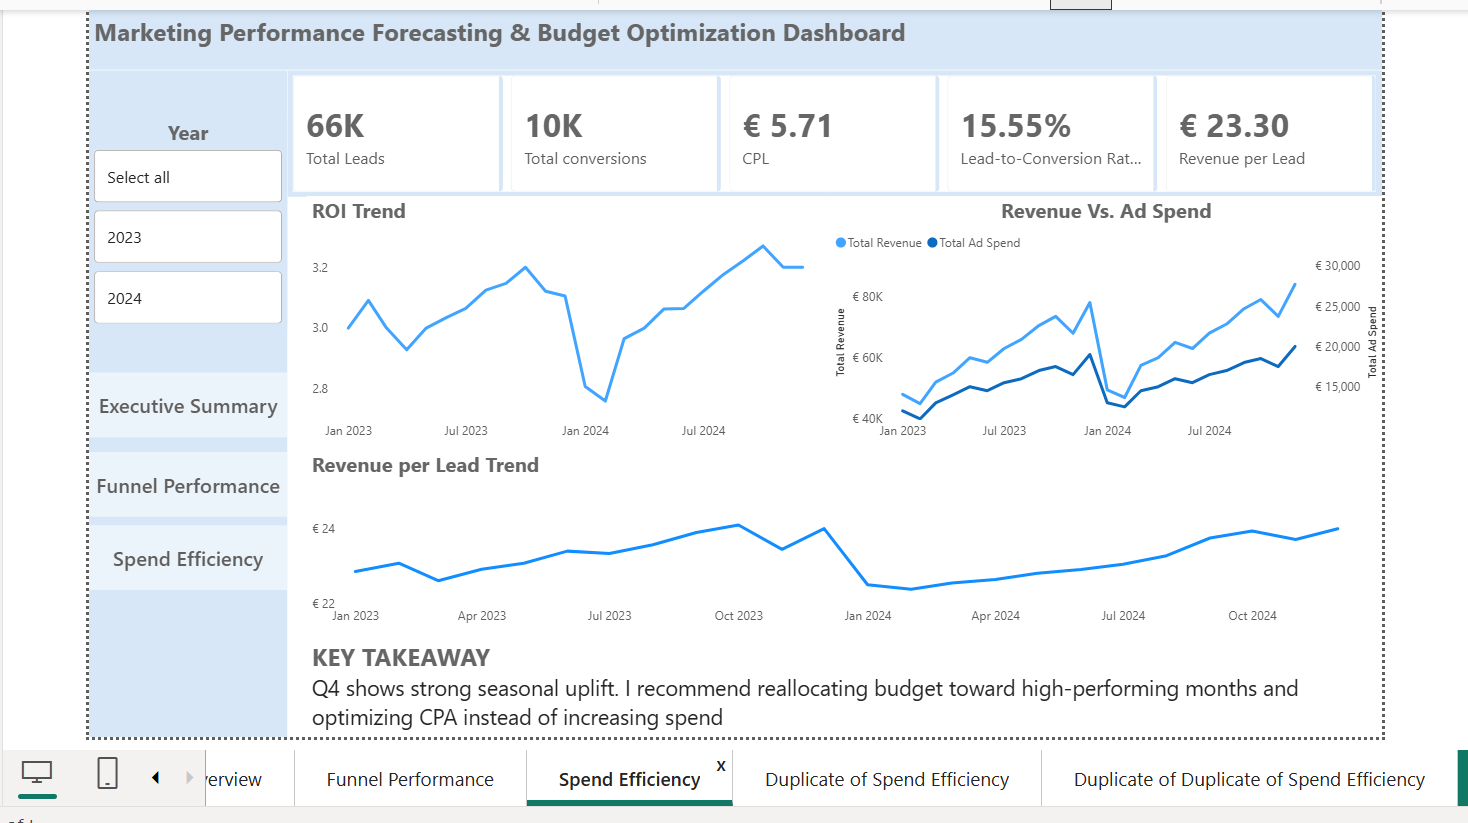
Spend Efficiency — advertising spend, ROI and revenue per lead.
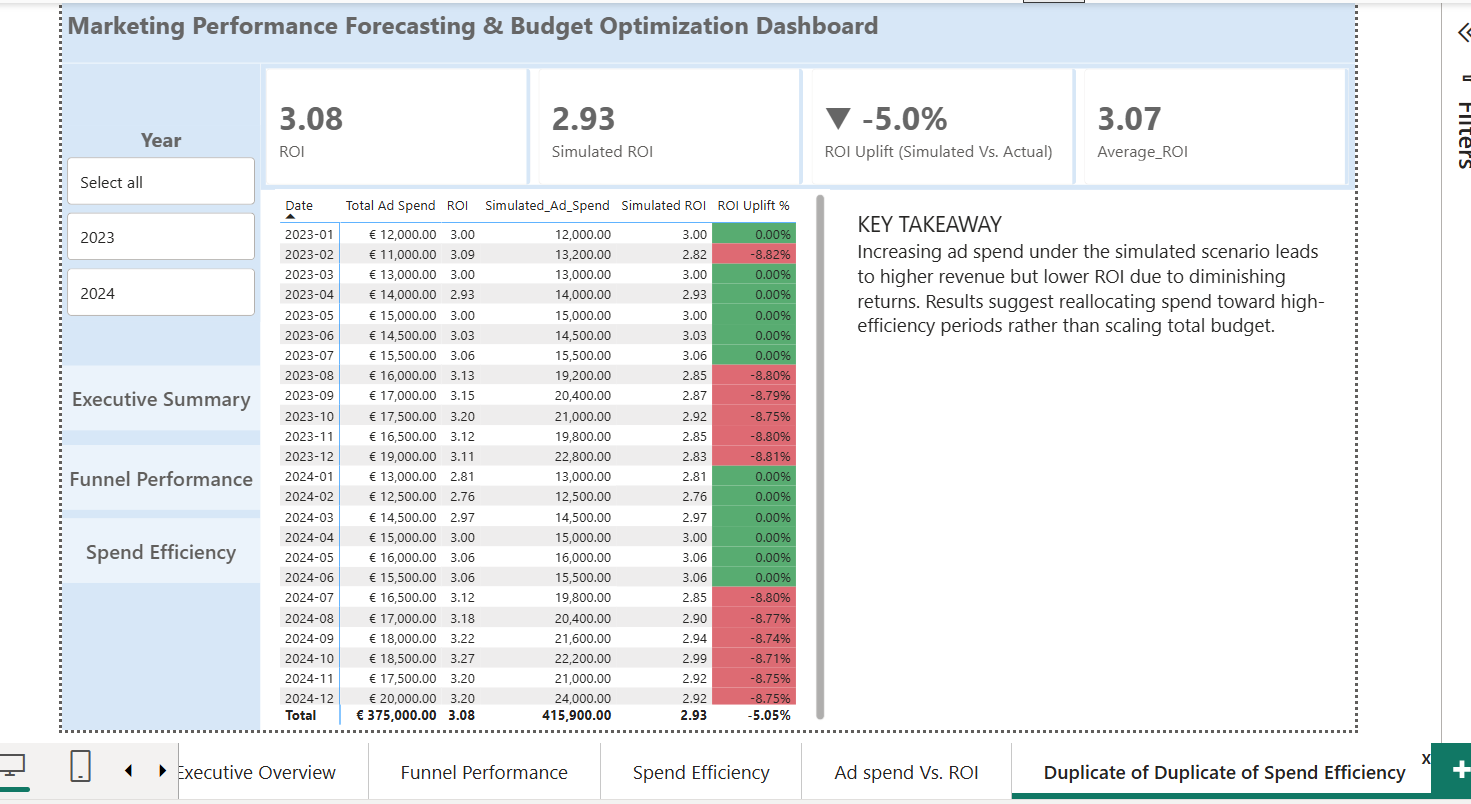
Budget Simulation — actual versus simulated advertising spend and ROI.
Revenue demonstrates an overall upward trend across the analysis period, with noticeable seasonal fluctuations and stronger performance toward Q4.
Lead and conversion volumes generally trend upward, while the lead-to-conversion rate remains relatively stable at 15.55%.
Increasing advertising spend can generate additional revenue, but the analysis suggests that incremental returns may decline at higher spending levels.
Revenue per lead provides an additional view of acquisition efficiency and helps evaluate whether additional leads are translating into sufficient value.
To test whether increasing advertising investment would improve efficiency, I created a simulated spending scenario that increased advertising spend during selected periods and compared simulated ROI with actual ROI.
| Metric | Actual | Simulated |
|---|---|---|
| ROI | 3.08 | 2.93 |
| ROI Uplift | — | -5.05% |
Key insight: The simulated increase in advertising spend produced higher spending but a lower overall ROI. This suggests that simply increasing the total marketing budget may not be the most efficient strategy when incremental returns are diminishing.
Concentrate marketing investment on periods and campaigns where additional spend continues to generate attractive returns.
Improve conversion efficiency alongside acquisition growth rather than relying solely on increased traffic or advertising spend.
Evaluate the incremental return generated by additional advertising investment before scaling campaign budgets.
Incorporate budget simulations into marketing planning to evaluate potential outcomes before making allocation decisions.
Overall recommendation: Rather than increasing total advertising spend indiscriminately, marketing investment should be concentrated on high-efficiency periods and campaigns while simultaneously improving conversion performance.
This project demonstrates how technical BI capabilities can be combined with business analysis to translate marketing data into actionable recommendations.
Related analysis: This Power BI dashboard builds on the same 24-month marketing dataset used in my Excel forecasting project. The Excel analysis focuses on forecasting, trends and seasonality, while this Power BI analysis extends the work into interactive KPI monitoring, funnel performance, ROI analysis and budget scenario analysis.